As featured in
Forbes – Business Insider – Huffington Post – Fox News – American Express – ABC News – Inc
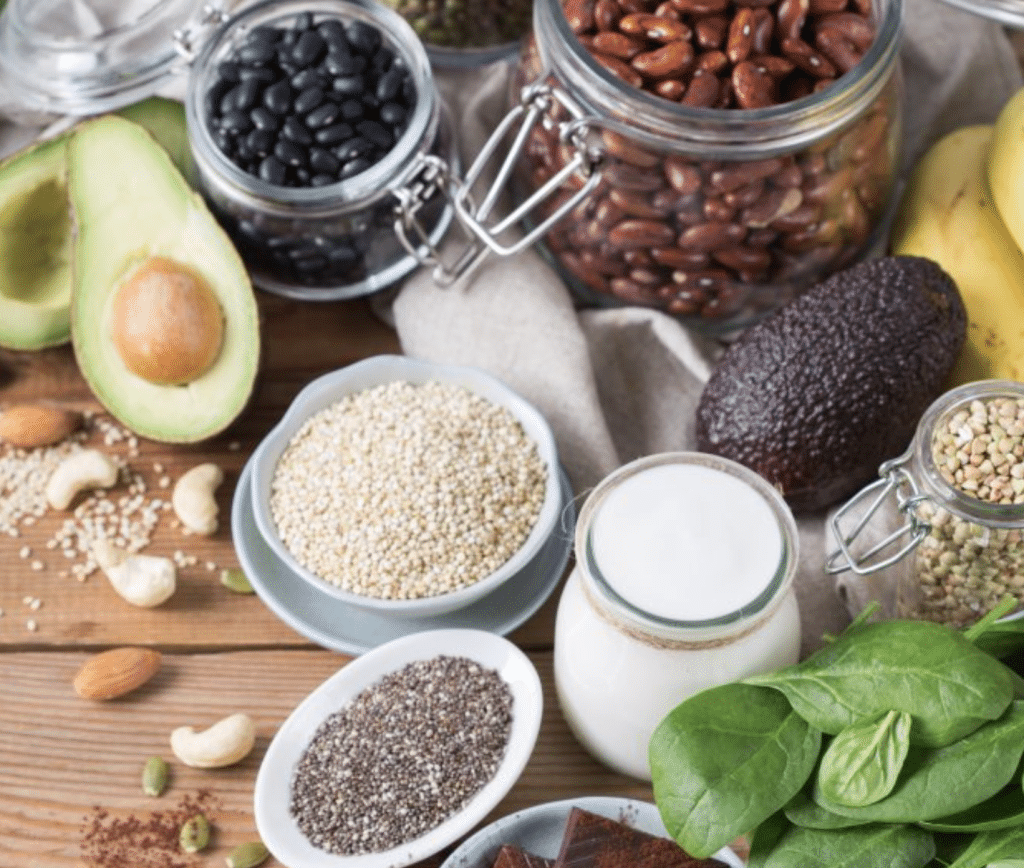
Food & Health
Straightforward nutrition, pantry know-how, and what the studies actually say.


Nostalgia
The toys, snacks, malls, and moments we grew up with — revisited.


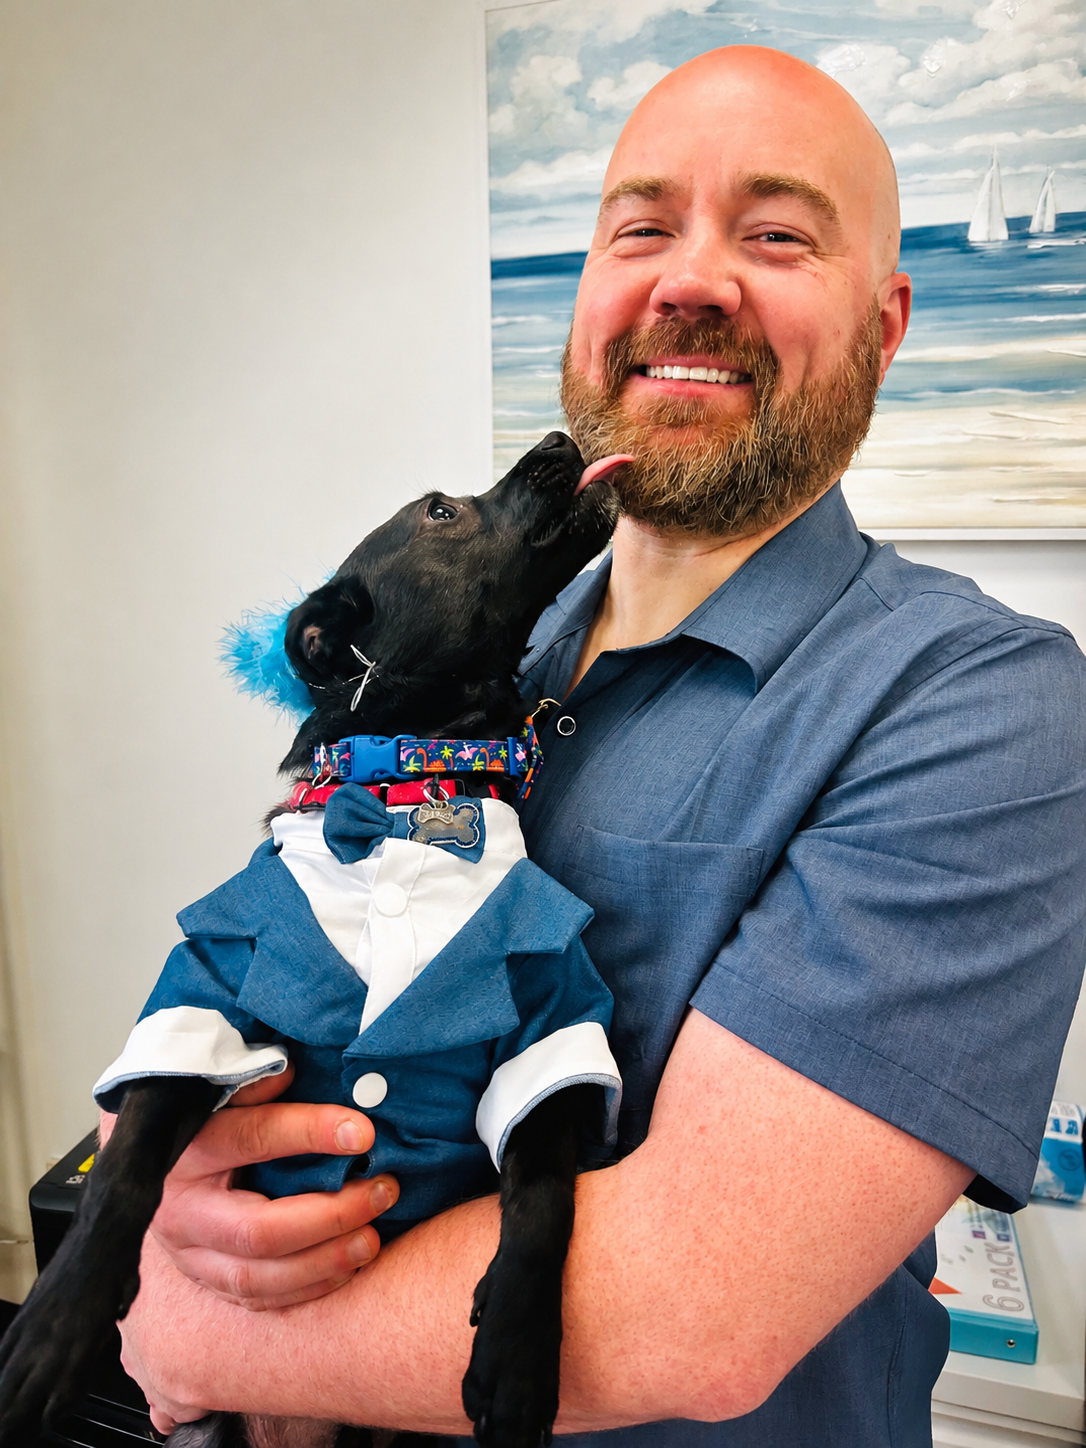
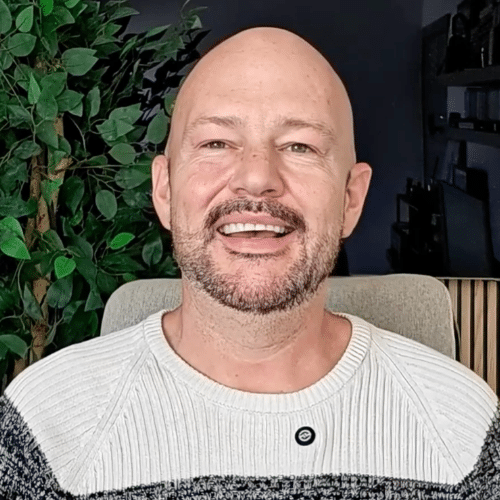
Meet the team
The humans behind Blogging.org.
Blogging.org is an independent online magazine run by Zac Johnson, who’s been publishing on the internet since 1997. Over the years, his work has been featured on Fox News, ABC News, and many other major outlets.
Unlike most sites today, every guide and article here is written, researched, and fact-checked by real people on our small team — not AI. We’re genuinely passionate about creating helpful, honest content for our readers.

Heidi
Rick

Kristel
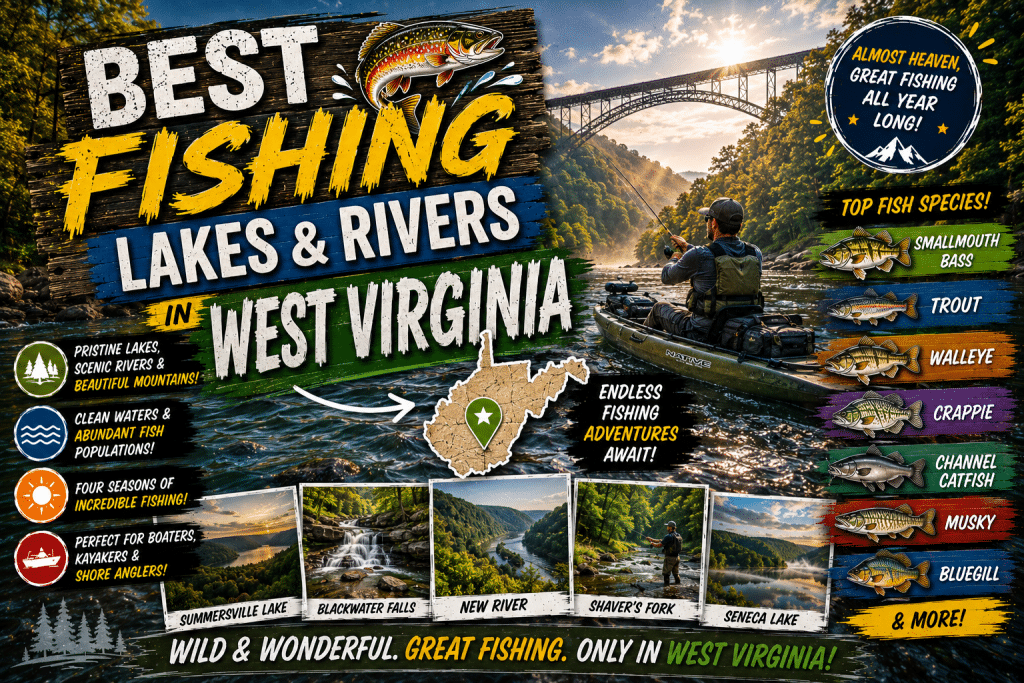
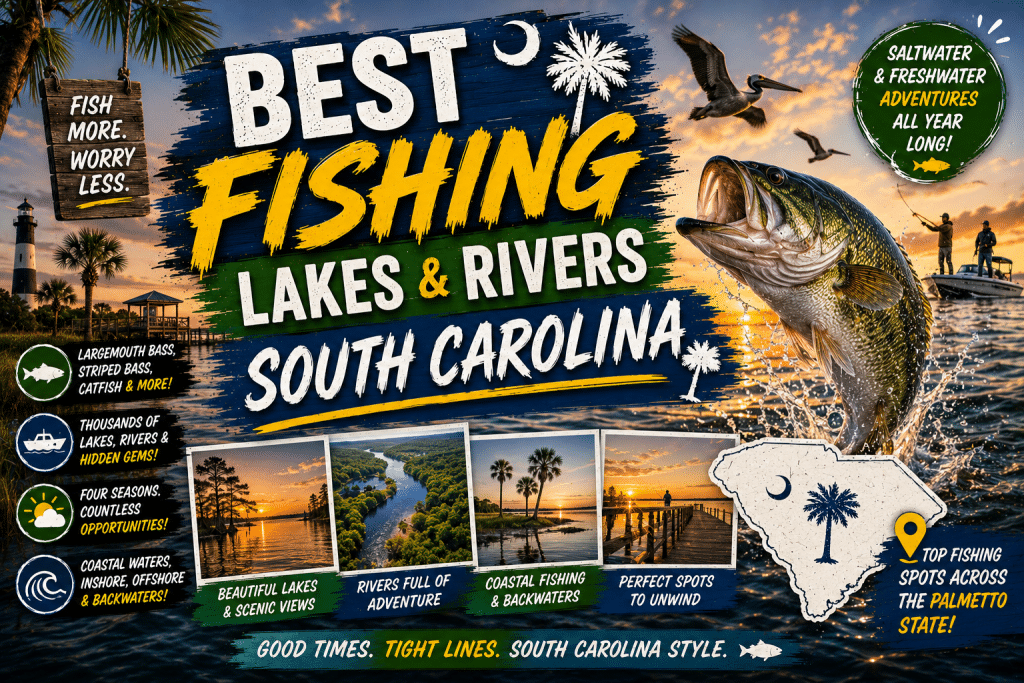
Outdoors
Fishing guides, wild places, and where to go next.


Finance Guides & Tools — no signup required.
Small, focused calculators built to answer one question at a time.